

Table of Links
2 Concepts in Pretraining Data and Quantifying Frequency
3 Comparing Pretraining Frequency & “Zero-Shot” Performance and 3.1 Experimental Setup
3.2 Result: Pretraining Frequency is Predictive of “Zero-Shot” Performance
4.2 Testing Generalization to Purely Synthetic Concept and Data Distributions
5 Additional Insights from Pretraining Concept Frequencies
6 Testing the Tail: Let It Wag!
8 Conclusions and Open Problems, Acknowledgements, and References
Part I
Appendix
A. Concept Frequency is Predictive of Performance Across Prompting Strategies
B. Concept Frequency is Predictive of Performance Across Retrieval Metrics
C. Concept Frequency is Predictive of Performance for T2I Models
D. Concept Frequency is Predictive of Performance across Concepts only from Image and Text Domains
F. Why and How Do We Use RAM++?
G. Details about Misalignment Degree Results
I. Classification Results: Let It Wag!
F Why and How Do We Use RAM++?
We detail why we use the RAM++ model [59] instead of CLIPScore [56] or open-vocabulary detection models [80]. Furthermore, we elaborate on how we selected the threshold hyperparameter used for identifying concepts in images.
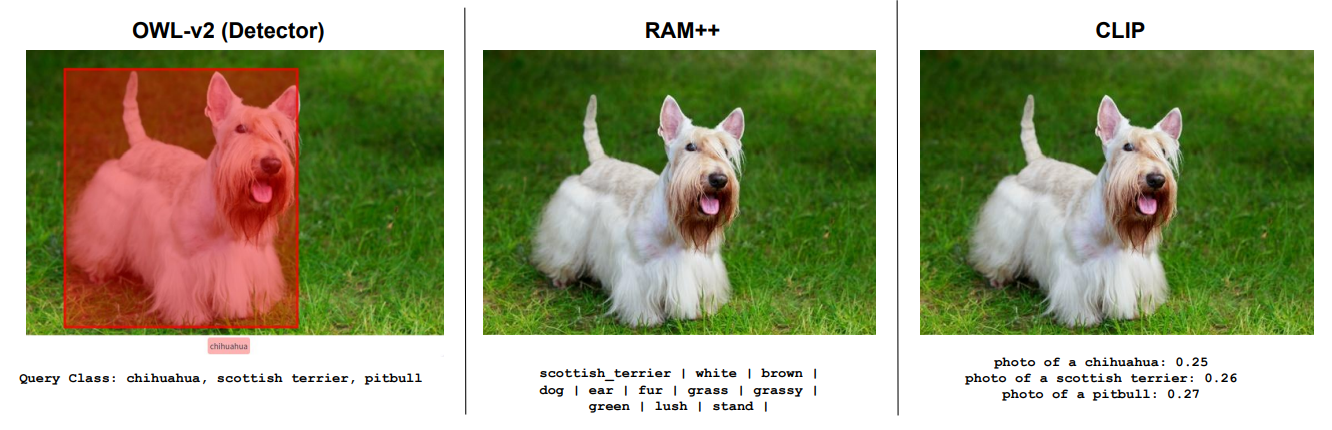
F.1 Why RAM++ and not CLIP or open-vocabulary detectors?
We provide some qualitative examples to illustrate why we chose RAM++. Our input images do not often involve complex scenes suitable for object detectors, but many fine-grained classes on which alongside CLIP, even powerful open-world detectors like OWL-v2 [80] have poor performance.
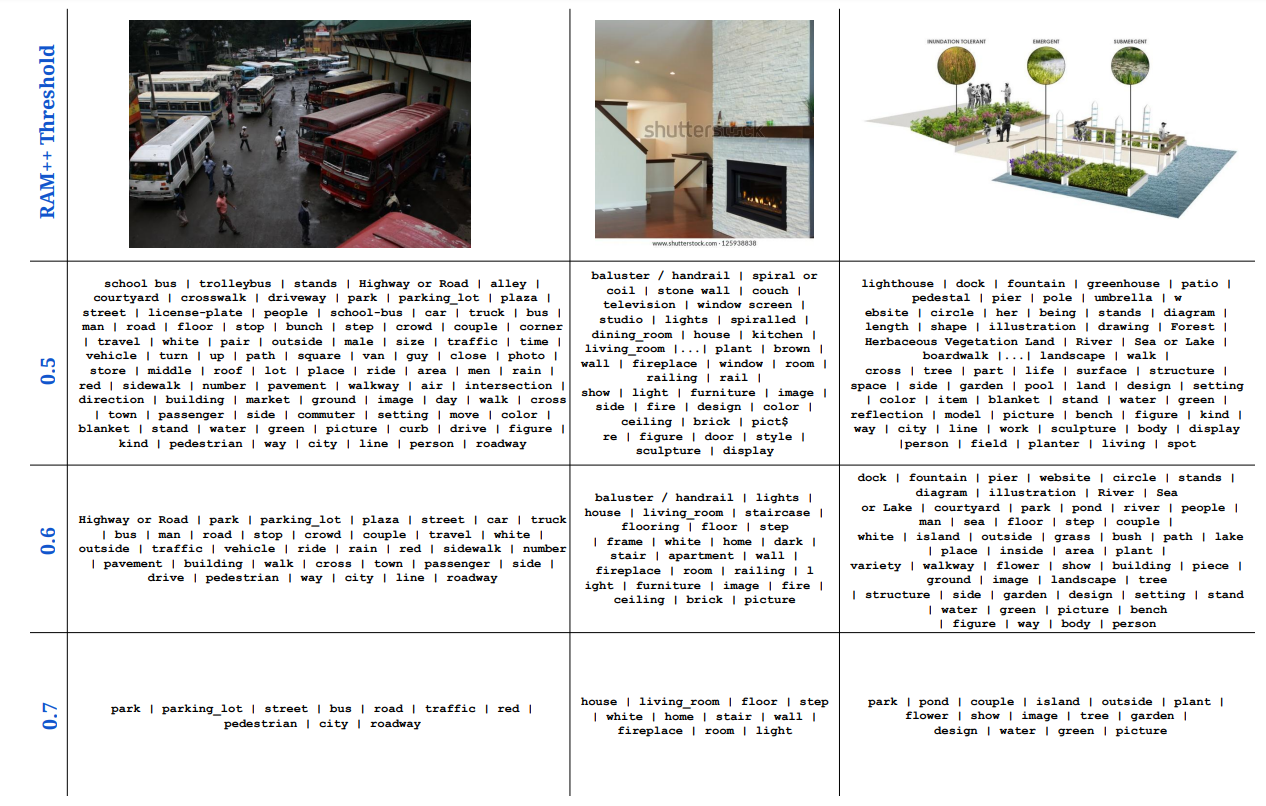
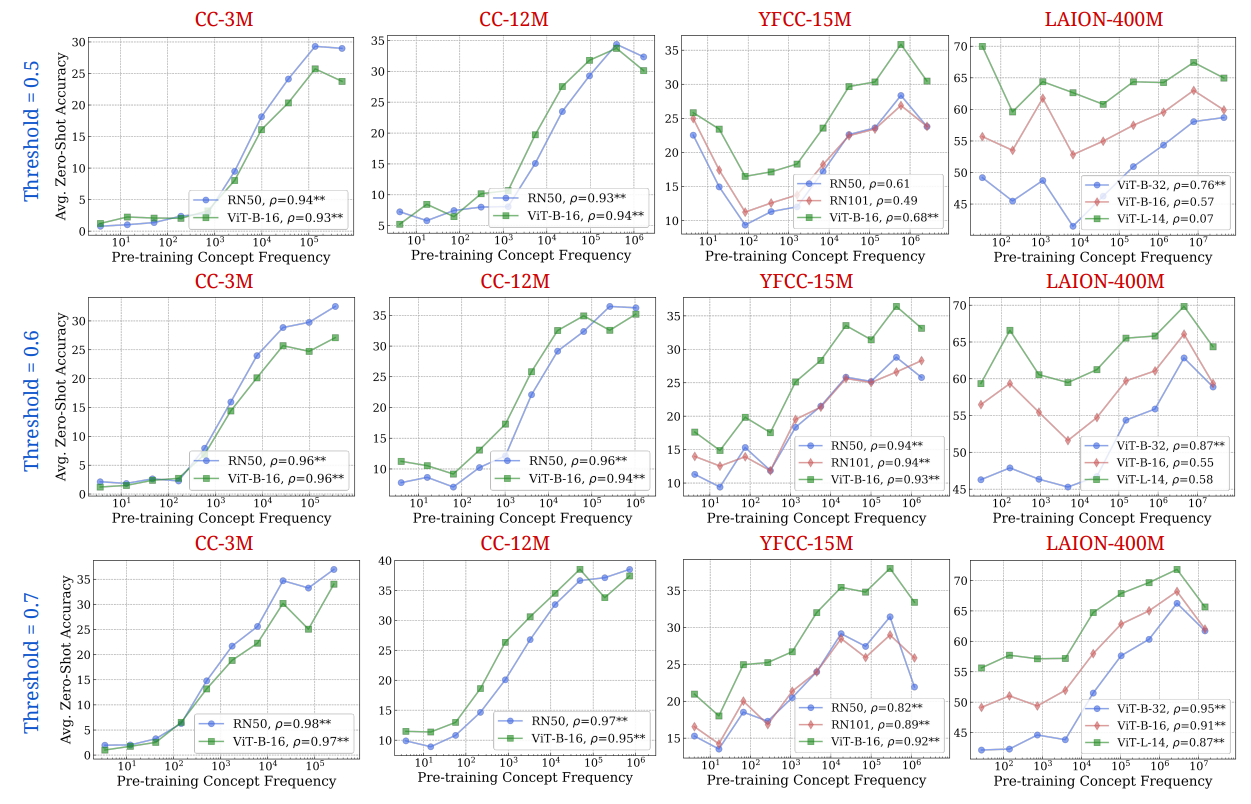
F.2 How: Optimal RAM++ threshold for calculating concept frequencies
We ablate the choice of the threshold we use for assigning concepts to images using the RAM++ model. For the given set of concepts, RAM++ provides a probability value (by taking a sigmoid over raw logits) for each concept’s existence in a particular image. To tag an image as containing a particular concept, we have to set a threshold deciding this assignnment. We test over three thresholds: {0.5, 0.6, 0.7}, showcasing quantitative and qualitative results for all thresholds in Figs. 20 and 21.
We observe best frequency estimation results using the highest frequency of 0.7. This is due to the high precision afforded by this threshold, leading to us counting only the “most aligned images” per concept as hits. With lower thresholds (0.5, 0.6), we note that noisier images that do not align well with the concept can be counted as hits, leading to degraded precision and thereby poorer frequency estimation. Hence, we use 0.7 as the threshold for all our main results.
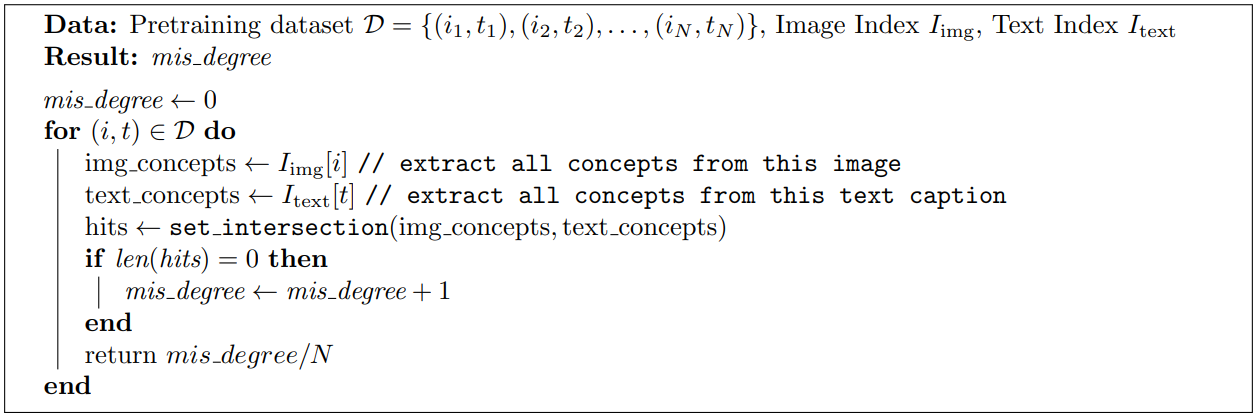
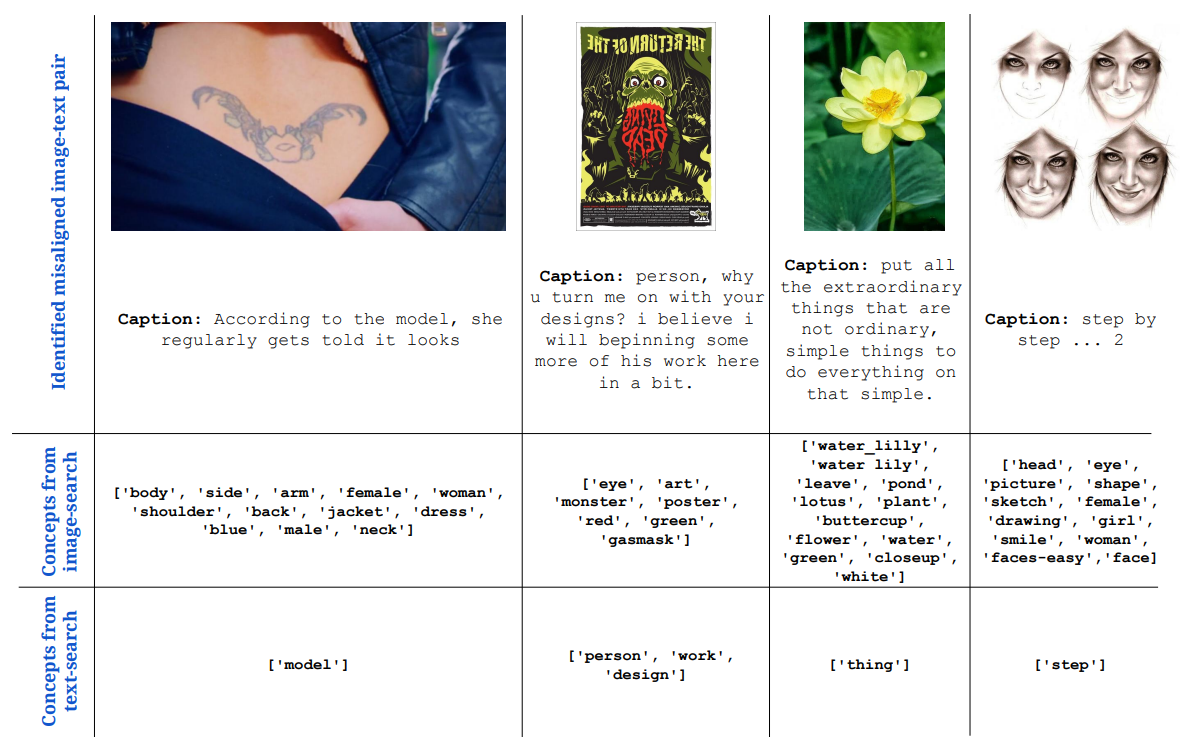
G Details about Misalignment Degree Results
In Tab. 3 in the main paper, we quantified the misalignment degree, and showcased that a large number of image-text pairs in all pretraining datasets are misaligned. In Alg. 1, we describe the method used for quantifying the misalignment degree for each pretraining dataset. We also showcase some qualitative examples of a few image-text pairs from the CC-3M dataset that are identified as misaligned using our analysis.
Authors:
(1) Vishaal Udandarao, Tubingen AI Center, University of Tubingen, University of Cambridge, and equal contribution;
(2) Ameya Prabhu, Tubingen AI Center, University of Tubingen, University of Oxford, and equal contribution;
(3) Adhiraj Ghosh, Tubingen AI Center, University of Tubingen;
(4) Yash Sharma, Tubingen AI Center, University of Tubingen;
(5) Philip H.S. Torr, University of Oxford;
(6) Adel Bibi, University of Oxford;
(7) Samuel Albanie, University of Cambridge and equal advising, order decided by a coin flip;
(8) Matthias Bethge, Tubingen AI Center, University of Tubingen and equal advising, order decided by a coin flip.
This paper is